Spring 2017 Intro and plotting/mapping with ggplot2!
Today was our first meeting of the Spring R group! We were playing catch up due to missing our first week (thanks ice storm) so we discussed the format of the working group as well as had a presentation about plotting/mapping using ggplot2.
We talked about the presentation schedule, the types of presentations, and future goals for the group. Our presentation schedule can be found on our main page. We still need people to present some Research Profiles on 2/8/17, 3/8/17, and 3/22/17. We still have a Package Introduction available (4/19/17) and packages we discussed profiling were Shiny or curl. If you have an interest in presenting a Research Profile or a Package Intro please contact Alli.
We also discussed going over dplyr, tidyr, R Markdown, and downloading high resolution graphics. We will cover these topics, and more, in our troubleshooting sessions and perhaps in full presentations if people desire.
Learning Opportunities
Relevant to our group we also talked about two workshops through CEREO on data carpentry and software carpentry. Thee data workshop will be held in 20-21 March, 2017. Registration, limited to 30 participants, will open in February 2017. The software carpentry workshop will be held 6-7 April, 2017. Registration, limited to 30 participants, will open in March 2017. More can be found here: https://cereo.wsu.edu/newsletter-2017-january/#201701Carpentry
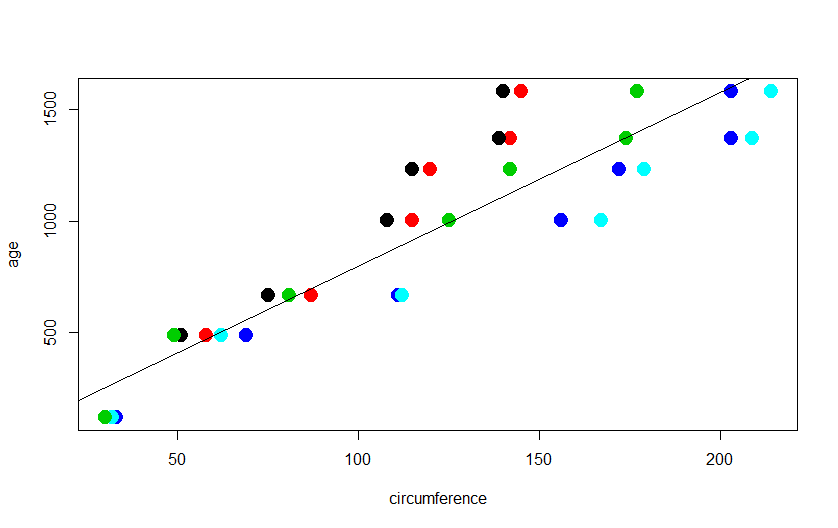
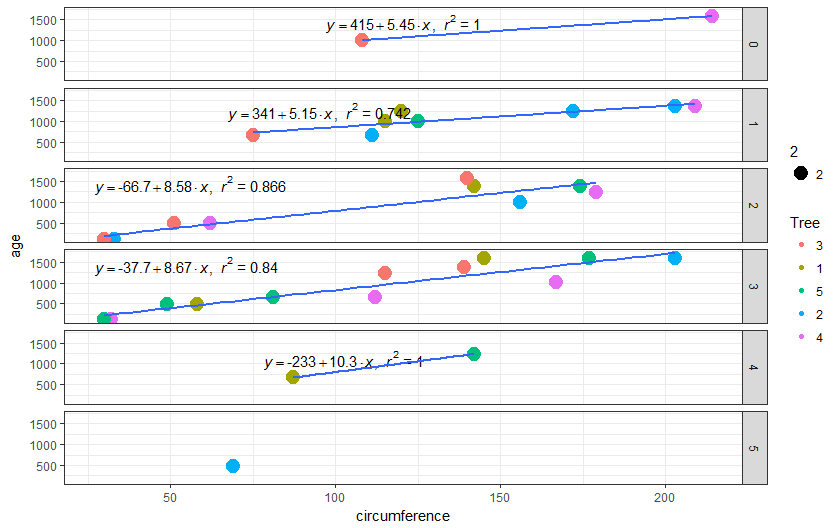
For our plotting exercises we went over the basic plotting syntax that exists in base R and then re-created some fancier plots using ggplot2. Additionally, responding to a question during the presentation, we added the equation and R2 for our regression lines to the plot using ggplot.
Basic R Plot:
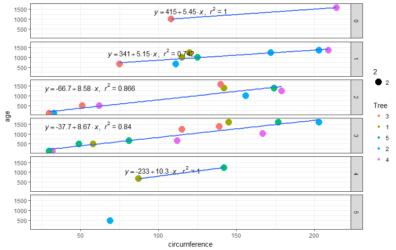
ggplot plot with samples broken up by treatment:
Packages required included:
library(maps)
library(mapdata)
library(mapproj)
library(ggplot2)
library(dplyr)
We also had an example of a ggplot map:
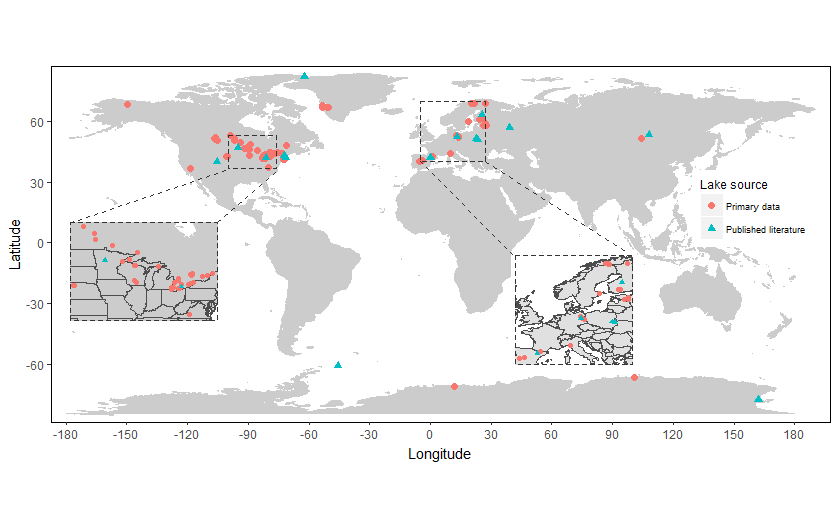
The script for the plots, and the map with its data, can be found below: